1 min read
Introducing SQL Database in Microsoft Fabric
Microsoft Fabric has traditionally concentrated on analytical databases, data transformation, and data visualization. Recently, Microsoft has...
2 min read

Dimensional modeling is a technique to organize your data in a way that is easily consumable for data analytics visualization tools and other data analytics products, such as PowerBI. Dimensional models are different from operational models in that they are highly de-normalized, whereas operational data tends to be highly normalized for application efficiency and security purposes. We call operational data OLTP sources (Online Transactional Processing) and analytical, or dimensional, data OLAP (Online Analytical Processing.)
These are examples of OLTP tables:
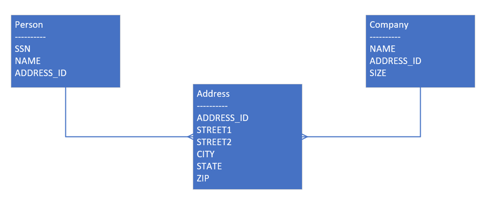
OLAP tables consist of facts and dimensions. A fact is a business measure or metric, and a dimension is a business entity. A fact could contain things like amount of a sale, length of time of a transaction, or a student grade. A dimension would be things like employees, dates, and organizations. Some examples:
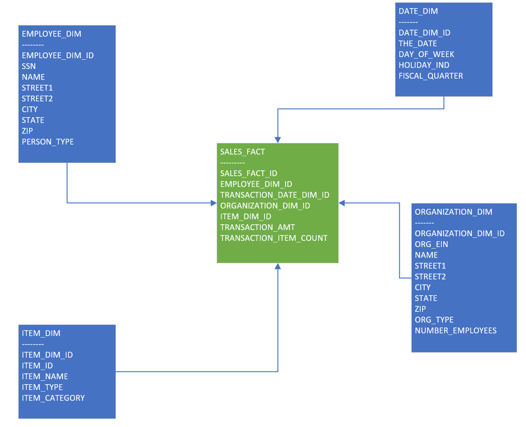
In the above diagram, we de-normalize the employee and organization tables by adding the addresses into those tables and adding additional typing. We add in an item dimension to see attributes about items being sold. The date dimension contains numerous attributes about a particular date (day of week, is it a holiday, what fiscal quarter is it in, etc.) This way, we can interrogate the fact by various dimensional attributes. The fact is the lowest level of granularity, in this case an individual sales transaction showing the item count and sale amount. We want the lowest level of granularity in our dimensional models so we can aggregate up as needed. If we do not bring in the lowest level, we cannot dilute the rows back to their source values.
There are several benefits of good dimensional modeling for analytics:
So, with good dimensional modeling techniques, users can quickly gain analytical insights to their data! Want to gain these insights for your company or discuss this topic further? Contact us today!

1 min read
Microsoft Fabric has traditionally concentrated on analytical databases, data transformation, and data visualization. Recently, Microsoft has...

1 min read
For decades, the Data Warehouse Subject Area pattern has served as the backbone of enterprise data architecture. These subject areas, such as Sales,...

1 min read
In today’s enterprise landscape, data often lives in silos — across on-premises systems, cloud databases, and analytics platforms. When we started...