.jpg) Dan LeBel
Dan LeBel
1 min read
Required Tools to Extend Power Virtual Agents
Extending Power Virtual Agents with Skills – Part 2 In part 1 of this series, I mentioned the “Bot Framework Composer” and “Bot Framework Emulator."...

Your company has an aging reporting environment containing thousands of reports developed over the previous 20+ years. The current reporting approach has failed to keep pace with the advancements in the industry and there are better available alternatives that will:
Your company has decided to move in this new direction and has asked for a plan identifying needed resources to get the job done in 18 to 24 months. What do you do?
What follows is a practical step-by-step guide and model to help you estimate the people resources, costs, and time needed to successfully get the job done.
Inventory the reports from the old system to be migrated to the new platform. Some of the things you want to learn about the existing reports are:
Determine the "who" - how the users are using the reports
Identify the set of reports that must be migrated
Determine the relative complexity of each report, identify:
NOTE: whatever set of criteria you use to evaluate the complexity of the reports – be consistent. In the next step you will use this data as input into the calculations used to determine needed resources.
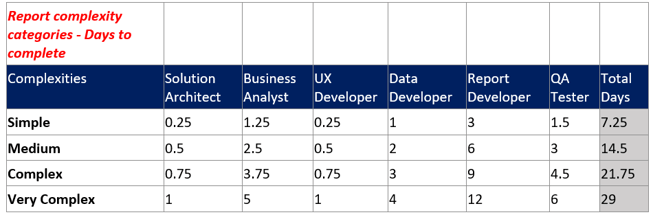
In this blog, let's limit the number of complexity levels to 4 (Simple, Medium, Complex, Very Complex). Each level being a multiple of simple (Simple being 1, Medium = 2x Simple, Complex = 3x Simple, Very Complex = 4x Simple).
Next, let's define the resource talent pool you will need to perform the work. In this example we will assume the following roles:
Lastly, for step 2, create a table of values estimating the time needed, by resource, for the different levels of complexity. Below is an example of such a table.
NOTE: Try to avoid assuming individual resources into multiple, different, roles in your model. Successful projects respect that a business analyst, though their individual intentions may be pure, is not a good substitute for a Solution Architect. The roles are different. Similarly, just because a developer may be able to design the user interface and could potentially do a satisfactory job, they are not specialists in the discipline of designing intuitive and keenly efficient user interfaces that comply with corporate standards. Developers are focused on getting the job done using a defined design and set of requirements.
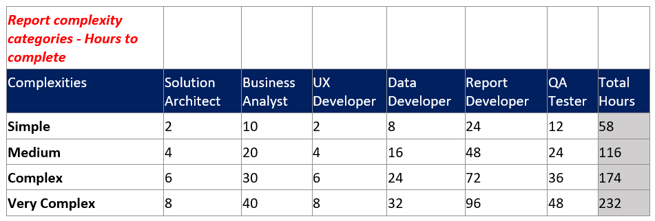
Of course, this "days" table translates into an "hours" table, as follows.
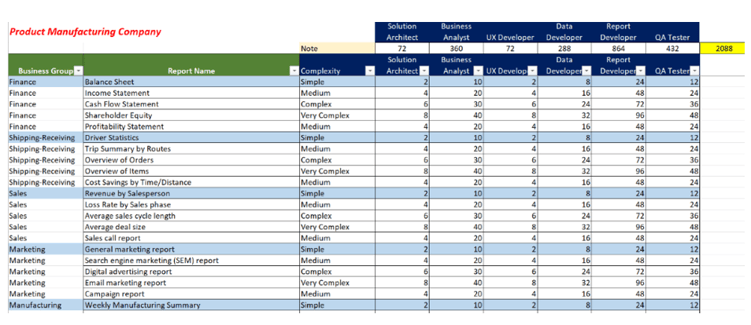
In this step, we begin to use the criteria we have developed (resource roles, report complexities, days and hours needed by role and by complexity) to create an "all-in" estimate of work hours required to complete the project.
The following example imagines reports for a Product Manufacturing firm. We have listed the reports associated with each department and, after using the complexity criteria listed in step 1, have been able to estimate the complexity of each report. Using the table of values we created in step 2, we are able to calculate the total level of effort (hours) required for each report as well as the cumulative total of hours by role for the entire project. The table below depicts the results of our exercise.
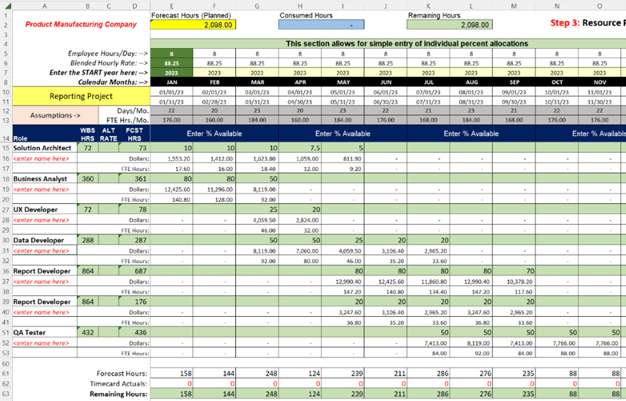
Here we use the data created in steps 1-3 to compose a real-world timeline that realistically consumes the resource hours calculated for each role. This exercise applies the assumptions of resource availability, available days and hours per month, and holiday impacts. This step makes you keenly aware of the timeline needed to consume the required hours for each resource while allowing you to better understand when resources are needed to come on or leave the project. The following assumptions are also worth noting.
Assumptions
Set up the timeline calendar (see graphic below)
NOTE: Work Days/Month - The "holidays" clause refers to a range of dates that you may create for the function to use to reduce the number of available workdays for that month.
Enter the resource utilization percentages by role
When you have completed entering your data, understand what the Resource Estimation model is telling you
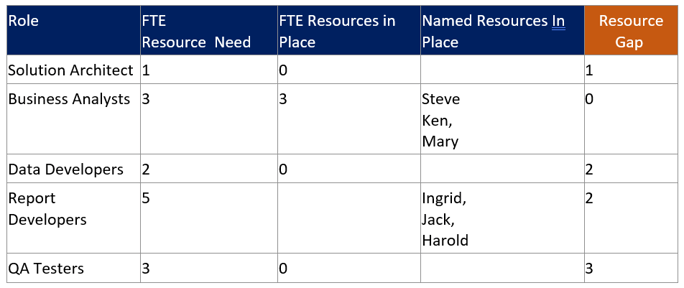
Step 5 Report the Resource Gaps and lobby the decision makers for the team you need to be successful.
Undoubtedly, prior to you being asked to develop an 18-24 month plan, senior management had a "gut" feeling of what it would cost and how long it would take to do the work. This model will allow you to have a more detailed and analysis-based conversation about needed resources and time. In this step, take a look at the resources the model is saying you need and the resources you currently have available. Compose a simple "Gap" table ahead of your conversation with the decision makers (example below).
This blog took us through a reasoned, model-based, discussion about understanding the work complexities, required resources, and time needed to satisfy a work request.
Following the steps to create the model allowed us to understand the hours needed by each role. The model also exposed the possible need for multiple resources for a given role to satisfy the work being completed in a given timeframe. Using the per-month cost calculations, we allow the company to better plan and manage the resource expenses over the duration of the project.
Lastly, the model brought us to a place where we could have the discussion with decision makers about what resources are needed to deliver the solution, on time, on budget, and on quality. If you have questions or want to discuss this topic further, please contact us today!

1 min read
Extending Power Virtual Agents with Skills – Part 2 In part 1 of this series, I mentioned the “Bot Framework Composer” and “Bot Framework Emulator."...
1 min read
Project Oakdale brings a built-in low code data platform capability for Microsoft Teams. It was first announced by Charles Lamanna on July 21st, 2020...

1 min read
Modern DevOps workflows increasingly rely on secure, automated authentication between CI/CD pipelines and cloud providers. GitHub’s OpenID Connect...