1 min read
Migrating Dataverse Data Between Tenants
Here at Spyglass, we are working on a project that includes migrating a Power Pages site to a new tenant. The process involves not only moving the...
3 min read
.png)
Data governance is an essential aspect of any organization that deals with data. It is the process of managing, protecting, and utilizing data efficiently to ensure its accuracy, integrity, and security. Microsoft Purview Data Map and Data Catalog (henceforth referred to as Purview) is a cloud-based data governance solution that helps organizations to discover, classify, and manage their data via meta data scanning and tagging. It also includes capabilities to display data lineage, a key component to see what atomic level data is used to feed various tables, reports, dashboards, etc..
This blog will give you the high level initial steps of standing up Purview for data governance. Each topic has much more depth to it, and we encourage you to investigate further or reach out to Spyglass if you have a need for organized, orderly data governance.
Here are the steps to start your data governance journey with Microsoft Purview:
The first step in data governance is to identify all the data assets that your organization wants to discover more about. This could include databases, data warehouses, files, AP calls, and other data sources.
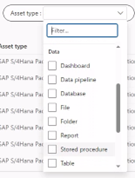
These are some examples of asset types (from Purview after scans were complete):
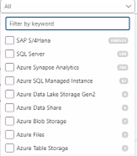
These are some examples of data source types (from Purview after scans were complete):
The collection hierarchies will be the way to organize metadata retrieved from various scans and correctly permission roles and responsibilities. They will also be a way to apply security to the metadata to ensure only the right people see the right data. Below is an example of a collection hierarchy:
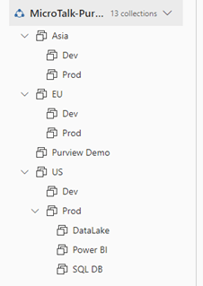
In the above case, the meta data results are organized regionally and then the development/production instances are further divided by data source type. This is one example and there are numerous ways to set this up, it just depends on your user experience and security needs. This would be the first place that a user interacts with the scan results, so it is critical to have it make sense to them so they do not struggle trying to find assets.
The data source map view allows you to quickly see all of your collections and what scans have been configured for each one:
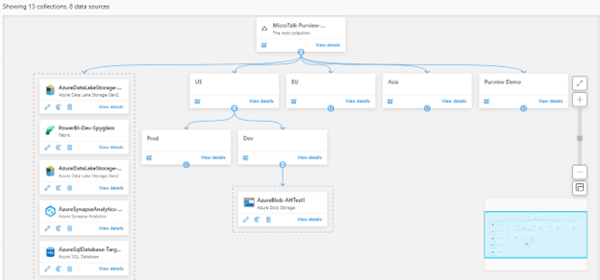
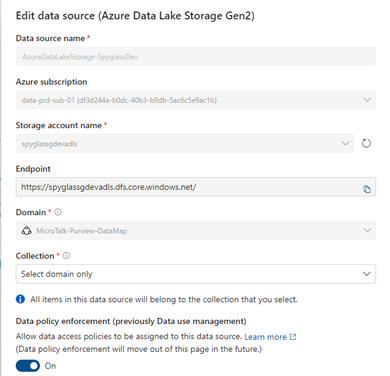
You can add new data sources for scanning from here like:
And then add scans to the data sources:
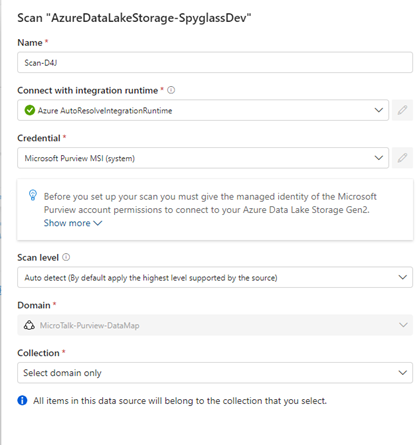
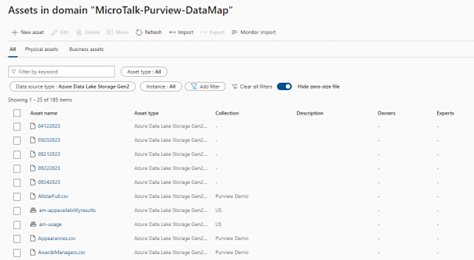
The above Purview scan will scan a specific instance of a Data Lake (Gen2 storage) and return whatever assets it finds. Here is a list of scanned assets:
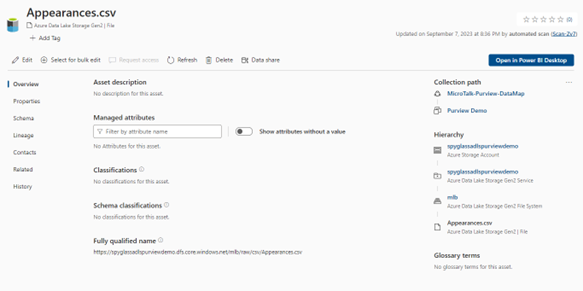
Each asset has numerous discovered properties:
You can further enrich the data scans by utilizing out of the box and/or custom data classifications (for supported data sources) which will enable the classification of the data as certain sensitive information types (SITs) such as names, SSN’s, bank accounts, and email addresses. You can also add custom classifications such as medical device numbers, etc.. to further tag your data. This classifying of data allows the ability to search where sensitive data exists in your data estate, enabling further security reviews of the actual (not metadata) data to ensure compliance and security.
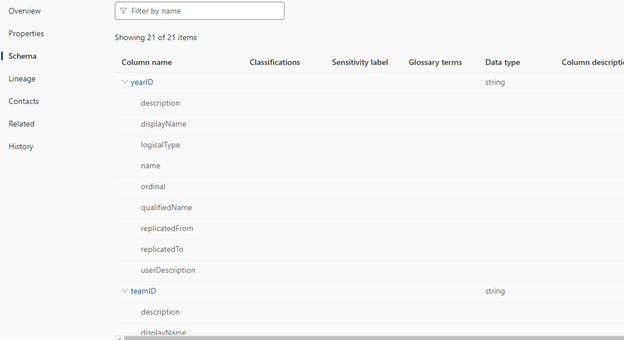
Data scans also retrieve schema information (if applicable) for assets, such as:
Where applicable, data lineage will also be presented:
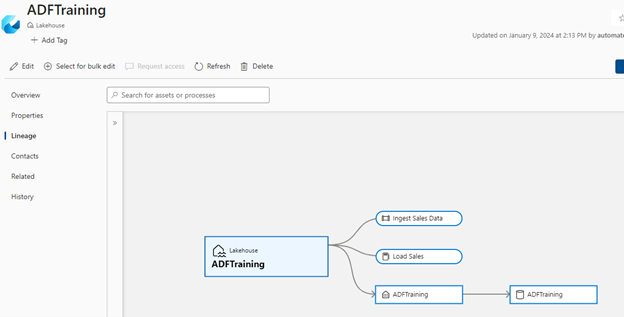
The above shows the various places a MS Fabric LakeHouse feeds data to.
There are also ways to customize ingestion and lineage gathering for data sources which are not supported out of the box, enabling a complete and accurate view of your data estate.
After scans are complete, data stewards and data curators can move assets around collections and enrich them as is appropriate.
Microsoft is also continually enhancing this tool. Two major changes are the creation of domains (available now) and the addition of data quality (in preview). Domains allow organizations to organize their assets and meta data security for “like” areas in a business, example:
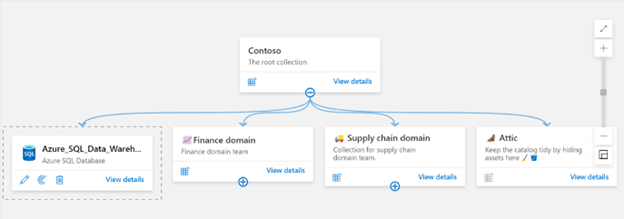
The assets above have been organized by portions of the business such as finance and supply chain. This allows data governance to be more focused on specific areas of the business. The above also includes “attic” space for assets that have no specific domain or are not useful at the moment.
Data quality will allow Purview to not only scan meta data but also actual data where rules can be applied to ensure data is complete and accurate, examples might include:
- Checking for NULL values
- Checking for correct phone number formats
- Checking for specific corporate date formats
Data quality will be further enhanced by AI, which will make recommendations on what additional rule sets should be added. Dashboards will enable viewing data quality progress as deficiencies are identified and cleansed.
With these (and other additions), MS Purview will establish itself as a one-stop tool for the data estate.
In conclusion, Microsoft Purview is a powerful tool for organizations looking to start their data governance journey. It provides a comprehensive suite of tools to discover, classify, and manage data assets and view asset details and asset lineage. MS Purview knocks down the silo walls in an organization and gives a true bird’s eye view of the entire data estate.
You can start small (with a single data source) and continue adding as you go in order to create the single source of meta data truth. Contact us today to get started!

1 min read
Here at Spyglass, we are working on a project that includes migrating a Power Pages site to a new tenant. The process involves not only moving the...

1 min read
Microsoft Fabric has traditionally concentrated on analytical databases, data transformation, and data visualization. Recently, Microsoft has...

1 min read
For decades, the Data Warehouse Subject Area pattern has served as the backbone of enterprise data architecture. These subject areas, such as Sales,...